# Network Artifacts
### Wireshark Tips
#### Find Packets
Apart from packet number, Wireshark can find packets by packet content. You can use the **"Edit --> Find Packet"** menu to make a search inside the packets for a particular event of interest. This helps analysts and administrators to find specific intrusion patterns or failure traces.
There are two crucial points in finding packets. The first is knowing the input type. This functionality accepts four types of inputs (Display filter, Hex, String and Regex). String and regex searches are the most commonly used search types. Searches are case insensitive, but you can set the case sensitivity in your search by clicking the radio button.
The second point is choosing the search field. You can conduct searches in the three panes (packet list, packet details, and packet bytes), and it is important to know the available information in each pane to find the event of interest. For example, if you try to find the information available in the packet details pane and conduct the search in the packet list pane, Wireshark won't find it even if it exists.

#### Mark Packets
Marking packets is another helpful functionality for analysts. You can find/point to a specific packet for further investigation by marking it. It helps analysts point to an event of interest or export particular packets from the capture. You can use the **"Edit"** or the **"right-click"** menu to mark/unmark packets.
Marked packets will be shown in black regardless of the original colour representing the connection type. Note that marked packet information is renewed every file session, so marked packets will be lost after closing the capture file.

#### Export Objects (Files)
Wireshark can extract files transferred through the wire. For a security analyst, it is vital to discover shared files and save them for further investigation. Exporting objects are available only for selected protocol's streams (DICOM, HTTP, IMF, SMB and TFTP).

#### Expert Info
Wireshark also detects specific states of protocols to help analysts easily spot possible anomalies and problems. Note that these are only suggestions, and there is always a chance of having false positives/negatives. Expert info can provide a group of categories in three different severities. Details are shown in the table below.
| **Severity** | **Colour** | **Info** |
| ------------ | ---------- | -------------------------------------------------------- |
| **Chat** | **Blue** | Information on usual workflow. |
| **Note** | **Cyan** | Notable events like application error codes. |
| **Warn** | **Yellow** | Warnings like unusual error codes or problem statements. |
| **Error** | **Red** | Problems like malformed packets. |
Frequently encountered information groups are listed in the table below. You can refer to [Wireshark's official documentation](https://www.wireshark.org/docs/) for more information on the expert information entries.
| **Group** | **Info** | **Group** | **Info** |
| ------------ | ------------------------ | -------------- | -------------------------- |
| **Checksum** | Checksum errors | **Deprecated** | Deprecated protocol usage |
| **Comment** | Packet comment detection | **Malformed** | Malformed packet detection |
You can use the **"lower left bottom section"** in the status bar or **"Analyse --> Expert Information"** menu to view all available information entries via a dialogue box. It will show the packet number, summary, group protocol and total occurrence.

#### Follow Stream
Wireshark displays everything in packet portion size. However, it is possible to reconstruct the streams and view the raw traffic as it is presented at the application level. Following the protocol, streams help analysts recreate the application-level data and understand the event of interest. It is also possible to view the unencrypted protocol data like usernames, passwords and other transferred data.
You can use the"right-click menu" or **"Analyse --> Follow TCP/UDP/HTTP Stream"** menu to follow traffic streams. Streams are shown in a separate dialogue box; packets originating from the server are highlighted with blue, and those originating from the client are highlighted with red.

Once you follow a stream, Wireshark automatically creates and applies the required filter to view the specific stream. Remember, once a filter is applied, the number of the viewed packets will change. You will need to use the "**X** **button**" located on the right upper side of the display filter bar to remove the display filter and view all available packets in the capture file.
#### Resolved Addresses
This option helps analysts identify IP addresses and DNS names available in the capture file by providing the list of the resolved addresses and their hostnames. Note that the hostname information is taken from DNS answers in the capture file. Analysts can quickly identify the accessed resources by using this menu. Thus they can spot accessed resources and evaluate them according to the event of interest. You can use the **"Statistics --> Resolved Addresses"** menu to view all resolved addresses by Wireshark.

#### Protocol Hierarchy
This option breaks down all available protocols from the capture file and helps analysts view the protocols in a tree view based on packet counters and percentages. Thus analysts can view the overall usage of the ports and services and focus on the event of interest. The golden rule mentioned in the previous room is valid in this section; you can right-click and filter the event of interest.You can use the **"Statistics --> Protocol Hierarchy"**

#### Conversations
Conversation represents traffic between two specific endpoints. This option provides the list of the conversations in five base formats; ethernet, IPv4, IPv6, TCP and UDP. Thus analysts can identify all conversations and contact endpoints for the event of interest. You can use the "Statistic --> Conversations" menu to view this info.

#### Endpoints
The endpoints option is similar to the conversations option. The only difference is that this option provides unique information for a single information field (Ethernet, IPv4, IPv6, TCP and UDP ). Thus analysts can identify the unique endpoints in the capture file and use it for the event of interest. You can use the "Statistics --> Endpoints" menu to view this info.
Wireshark also supports resolving MAC addresses to human-readable format using the manufacturer name assigned by IEEE. Note that this conversion is done through the first three bytes of the MAC address and only works for the known manufacturers. When you review the ethernet endpoints, you can activate this option with the**"Name resolution"**button in the lower-left corner of the endpoints window.

Name resolution is not limited only to MAC addresses. Wireshark provides IP and port name resolution options as well. However, these options are not enabled by default. If you want to use these functionalities, you need to activate them through the **"Edit --> Preferences --> Name Resolution"**menu. Once you enable IP and port name resolution, you will see the resolved IP address and port names in the packet list pane and also will be able to view resolved names in the "Conversations" and "Endpoints" menus as well.

Endpoint menu view with name resolution:

Besides name resolution, Wireshark also provides an IP geolocation mapping that helps analysts identify the map's source and destination addresses. But this feature is not activated by default and needs supplementary data like the GeoIP database. Currently, Wireshark supports MaxMind databases, and the latest versions of the Wireshark come configured MaxMind DB resolver. However, you still need MaxMind DB files and provide the database path to Wireshark by using the "Edit --> Preferences --> Name Resolution --> MaxMind database directories" menu. Once you download and indicate the path, Wireshark will automatically provide GeoIP information under the IP protocol details for the matched IP addresses

Endpoints and GeoIP view:

### Wireshark Filters
#### IP Filters
IP filters help analysts filter the traffic according to the IP level information from the packets (Network layer of the OSI model). This is one of the most commonly used filters in Wireshark. These filters filter network-level information like IP addresses, version, time to live, type of service, flags, and checksum values.
The common filters are shown in the given table.
| Filter | Description |
| ---------------------------- | ----------------------------------------------------------------------------------------------------------------------------------------------------------- |
| `ip` | Show all IP packets. |
| `ip.addr == 10.10.10.111` | Show all packets containing IP address 10.10.10.111. |
| `ip.addr == 10.10.10.0/24` | Show all packets containing IP addresses from 10.10.10.0/24 subnet. |
| `ip.src == 10.10.10.111` | Show all packets originated from 10.10.10.111 |
| `ip.dst == 10.10.10.111` | Show all packets sent to 10.10.10.111 |
| ip.addr **vs** ip.src/ip.dst | **Note:** The ip.addr filters the traffic without considering the packet direction. The ip.src/ip.dst filters the packet depending on the packet direction. |
#### TCP and UDP Filters
TCP filters help analysts filter the traffic according to protocol-level information from the packets (Transport layer of the OSI model). These filters filter transport protocol level information like source and destination ports, sequence number, acknowledgement number, windows size, timestamps, flags, length and protocol errors.
| Filter | Description | Filter | Expression |
| --------------------- | ----------------------------------------------- | --------------------- | ----------------------------------------------- |
| `tcp.port == 80` | Show all TCP packets with port 80 | `udp.port == 53` | Show all UDP packets with port 53 |
| `tcp.srcport == 1234` | Show all TCP packets originating from port 1234 | `udp.srcport == 1234` | Show all UDP packets originating from port 1234 |
| `tcp.dstport == 80` | Show all TCP packets sent to port 80 | `udp.dstport == 5353` | Show all UDP packets sent to port 5353 |

#### Application Level Protocol Filters | HTTP and DNS
Application-level protocol filters help analysts filter the traffic according to application protocol level information from the packets (Application layer of the OSI model ). These filters filter application-specific information, like payload and linked data, depending on the protocol type.
| Filter | Description | Filter | Description |
| ------------------------------- | ---------------------------------------------- | ------------------------- | ------------------------ |
| `http` | Show all HTTP packets | `dns` | Show all DNS packets |
| `http.response.code == 200` | Show all packets with HTTP response code "200" | `dns.flags.response == 0` | Show all DNS requests |
| `http.request.method == "GET"` | Show all HTTP GET requests | `dns.flags.response == 1` | Show all DNS responses |
| `http.request.method == "POST"` | Show all HTTP POST requests | `dns.qry.type == 1` | Show all DNS "A" records |
#### Filter: "contains"
| Filter | **contains** |
| --------------- | -------------------------------------------------------------------------------------------------------------------------------------------- |
| **Type** | Comparison Operator |
| **Description** | Search a value inside packets. It is case-sensitive and provides similar functionality to the "Find" option by focusing on a specific field. |
| **Example** | Find all "Apache" servers. |
| **Workflow** | List all HTTP packets where packets' "server" field contains the "Apache" keyword. |
| **Usage** | `http.server contains "Apache"` |
#### Filter: "matches"
| Filter | **matches** |
| ----------- | ------------------------------------------------------------------------------------------------------------- |
| Type | Comparison Operator |
| Description | Search a pattern of a regular expression. It is case insensitive, and complex queries have a margin of error. |
| **Example** | Find all .php and .html pages. |
| Workflow | List all HTTP packets where packets' "host" fields match keywords ".php" or ".html". |
| **Usage** | `http.host matches "\.(php\|html)"` |
### Network Artifacts
Network Artifacts also belong to the yellow zone in the Pyramid of Pain. This means if you can detect and respond to the threat, the attacker would need more time to go back and change his tactics or modify the tools, which gives you more time to respond and detect the upcoming threats or remediate the existing ones.\
A network artifact can be a user-agent string, C2 information, or URI patterns followed by the HTTP POST requests.An attacker might use a User-Agent string that hasn’t been observed in your environment before or seems out of the ordinary. The User-Agent is defined by [RFC2616](https://datatracker.ietf.org/doc/html/rfc2616#page-145) as the request-header field that contains the information about the user agent originating the request.
Network artifacts can be detected in Wireshark PCAPs (file that contains the packet data of a network) by using a network protocol analyzer such as [TShark](https://www.wireshark.org/docs/wsug_html_chunked/AppToolstshark.html) or exploring IDS (Intrusion Detection System) logging from a source such as [Snort](https://www.snort.org/).
HTTP POST requests containing suspicious strings:
Let's use TShark to filter out the User-Agent strings by using the following command:
```
tshark --Y http.request -T fields -e http.host -e http.user_agent -r analysis_file.pcap
```
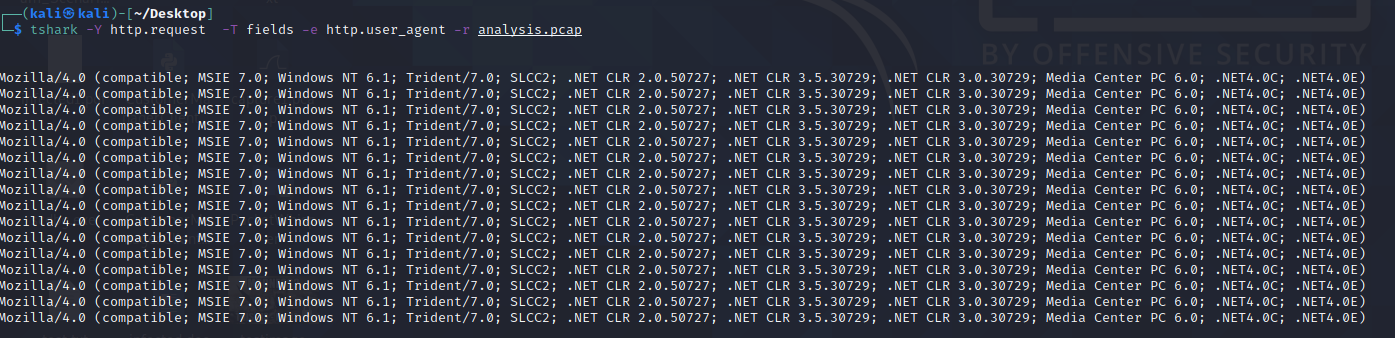
These are the most common User-Agent strings found for the [Emotet Downloader Trojan](https://www.mcafee.com/blogs/other-blogs/mcafee-labs/emotet-downloader-trojan-returns-in-force/)
If you can detect the custom User-Agent strings that the attacker is using, you might be able to block them, creating more obstacles and making their attempt to compromise the network more annoying.
