WinDBG
Running & Restarting Binaries
Starting a program and breaking at its entry point
1. Finding the Entry Point
List Modules: Type
lmin the command bar to see the list of loaded modules and confirmscratchpad.exeis there.Find Entry Point: Instead of
$entry, try using the expression evaluator to find where the executable starts:? $exentryThis will give you the address of the entry point defined in the PE header. You can then disassemble there usingu $exentry
By default when you open an executable in WinDbg, it will stop at a breakpoint in the ntdll.dll file, after your program is loaded, but before main() is called. This will give you an opportunity to set breakpoints within the target executable. When you load a binary, WinDbg parses the file's PE (Portable Executable) Header. Inside the OPTIONAL_HEADER structure, there is a specific field called AddressOfEntryPoint.
WinDbg simply reads this memory address and assigns it to the $exentry pseudo-register. This is the exact memory address where the Windows OS loader will hand over control to the application after setting up the process space.
If you have symbols (definitions for functions, variables, etc) for the executable, a breakpoint can be set based on a symbol name. But in many cases you will not have symbols, unless you’re debugging code you wrote, or Microsoft wrote and which they provide symbols for.
Therefore, you can generically set a breakpoint at the first assembly instruction of that binary by issuing the command u $exentry.
u $exentry tells the debugger to unassemble (disassemble) the code at the entry point so you can read it first.
u $exentry
However, this will typically be within the C runtime, a function which calls main()”, rather than main() itself. Therefore, you may need to step over some boilerplate executable setup to find the main() code.
uf (Unassemble Function): This is "smart" disassembly. If you type uf <address>, WinDbg analyzes the code. It finds where the function starts, follows all the internal jumps, loops, and if/else branches, and prints out the entire function grouped into logical blocks until it hits the final ret (return) instruction.

Important


Doing this on a reference executable like Fibber.exe, as shown in the video below, can help you get a sense of what C runtime library waypoints you might see on your way to main() (though this will differ based on whether you’re testing on a debug-built vs. release-built executable.)
If unable to find the main
1. Check for Symbols
If WinDbg doesn't know where your .pdb (symbol) file is, it won't be able to find main by name. Use the examine command:
Type this in the command bar:
x scratchpad!*main* or use the following general command
What to look for: If you see something like
scratchpad!mainorscratchpad!wmain, you’re in luck.
The Command Components
x: Tells WinDbg to search the symbol table for a specific pattern.scratchpad!: This specifies the module (the EXE or DLL) you want to search. By adding the!, you are telling WinDbg to look insidescratchpad.exespecifically.*main*: These are wildcards. Since compilers often rename yourmainfunction to things likemainCRTStartup,wmain, or__scrt_common_main_seh, the asterisks act as catch-alls. This finds anything that has the word "main" anywhere in the name.
How to use the output to set your BP
When you run that command, you will likely see a list that looks like this: 0000000140001230 scratchpad!main (void)`
To set the breakpoint once you see that address, you can either:
Use the name:
bp scratchpad!mainUse the address:
bp 0000000140001230

2. Set the Breakpoint (BP)
Once you have the name (or if you just want to try the most common names), run these commands:
Set the BP:
bu scratchpad!mainNote: I used
bu(breakpoint unresolved). This is "stickier" and works better if the module hasn't fully loaded its symbols yet.Resume Execution:
g(or press F5)
The Difference Between bp and bu
bp and bubp(Breakpoint - Address-Based): When you usebp, WinDbg goes to the exact, hardcoded memory address that exists right now (like0x140001260) and temporarily overwrites the first byte of the instruction with anint 3software interrupt (the hex byteCC).The Flaw: If you restart the debugging session and Address Space Layout Randomisation (ASLR) loads the binary at a totally different memory address, your
bpThe breakpoint is completely useless because it is pointing to an old address.
bu(Breakpoint Unresolved - Symbol-Based): When you usebu, you are setting a breakpoint on a name (likescratchpad!main), not a hard number. WinDbg saves this symbolic name in a logical list.The Magic: If
scratchpad.exehasn't even been fully mapped into memory yet, WinDbg just says, "Okay, I'll keep an eye out." The absolute microsecond the OS loads that module and resolves the symbols, WinDbg automatically figures out the math and sets the trap. If the program restarts, WinDbg just recalculates the new ASLR address and reapplies it.
Continuing execution of a program stopped at a breakpoint
Use the Go button in the toolbar as shown below:

or
Select Menu Bar -> Debug -> Go (shortcut F5).
or
The g command in the Command window will let the execution go.
Restarting a program
Use the Restart button in the tool bar as shown below:

or
Select Menu Bar -> Debug -> Restart (shortcut ctrl+shift+F5).
or
The .restart command in the Command window will restart program execution from the beginning.
Setting Code Breakpoints:
Click on the source/assembly and hit the “Insert or remove breakpoint” button shown below:

or
Click on the source/assembly and hit shortcut F9 to insert a breakpoint.
or
Enter
in the Command window (for BreakPoint)
Listing Code Breakpoints:
bl in the Command window (for “Breakpoint List")
Note the numbers for each breakpoint, as those numbers will be used for other commands like the “bc” below
Unsetting Code Breakpoints:
bc in the Command window (for Breakpoint Clear)
or
Click the “clear” link shown for a given breakpoint in the bl output
Break On Write-Only Access
A simplified form of the break on access command is:
ba <access type> <data size> <address>
Where:
<access type> == w (for write-access)
<data size> == 1, 2, 4, or 8 (bytes)
<address> == an absolute address, symbol name, or calculation of an address like rsp+0x24.
So for instance to break when 4 bytes are written to address 000000000014fdf4, you would enter:
ba w 4 000000000014fdf4
See the MS documentation for ba for the full syntax and supported forms.
Break On Read-And-Write Access
The ba instruction does not support a “break on read-only” capability, because Intel hardware does not have this capability. Some debuggers simulate this, by setting both a break on read/write and a break on write, and then determining if the break must have been a read-only access. But this takes up twice as many hardware breakpoints (discussed more later). WinDbg however does not offer this capability. Therefore it is your job to determine based on the assembly instruction which the code is stopped at whether it was a read or a write.
Therefore the syntax to set a “break on read and write” access is the same as the above, but with the r access type. I.e.:
ba r 4 000000000014fdf4
See the MS documentation for ba for the full syntax and supported forms.
Break On Read-Only Access
I just said, there’s no support for that :P
Disabling Breakpoints:
bd <breakpoint number given in bl> in the Command window.
Or clicking the “Disable” link in the bl output, if the breakpoint is currently enabled.
Enabling Breakpoints:
be <breakpoint number given in bl> in the Command window (for Breakpoint Enable).
Or clicking the “Enable” link in the bl output if a breakpoint is currently disabled.
Hardware vs. Software Breakpoints on Intel Hardware
Intel has separate concepts of a “hardware” breakpoint vs. a “software” breakpoint. It is generally possible to set an unlimited number of software breakpoints, because they take the form of a single byte “interrupt 3” (0xCC) instruction, which the debugger writes into the instruction stream wherever it would like to break. When the interrupt occurs, it ultimately leads back to the debugger, which can update its metadata about what breakpoint fired where, rewrite the instruction stream so the original instruction can occur, update the UI for the human, and allow the execution to continue.
On the other hand, there are a limited number (4) of dedicated Intel special-purpose debug registers. These registers inform the memory management unit that it should watch for read, write, execute, or IO accesses targeted the specified addresses/IO ports. The ba instructions we previously saw are actually utilizing the hardware breakpoints behind the scenes. But we only saw write or read+write breakpoints. They also support break on execute. The advantage of a hardware break on execute is that the memory targeted may not actually be mapped into the program’s memory space yet. But if you know the address it will be at later, once it is mapped in, then you can set a breakpoint for there and the processor will alert the debugger when the breakpoint is hit. This is most useful when dealing with malware which has intentional dynamism to the instructions it executes, or in the kernel where different physical memory can be mapped to the same virtual memory address at different times.
Hardware Break On Execute
A simplified form of the break on access command is for breaking on execute is:
ba <access type> <data size> <address>
Where:
<access type> == e (for execute).
<data size> == 1 (WinDbg mandates that the size must be 1 if the type is “e").
<address> == an absolute address, symbol name, or calculation of an address like rsp+0x24.
So for instance to break when address 0000000140001050 is executed, you would enter:
ba e 1 0000000140001050
Note: You can’t set a break on access breakpoint from the system debug breakpoint where windbg stops you when you first execute a binary. Because hardware debug registers are saved and restored as part of thread state, and the thread state will be swapped out between the system debug point and the execution of the binary - thus “losing” the hardware breakpoints you may set. Instead, set a software breakpoint like bp $exentry (the executable entry point), and set hardware breakpoints from there.
See the MS documentation for ba for the full syntax and supported forms
Viewing Registers
Create and place a register window as was shown in the UI setup video.

or
Type r and a comma-deliminated set of register names to print out their values. E.g.
MS documentation for r MS documentation for viewing & editing registers
Modifying Registers
In the register window, double-click into the desired register and start typing to change the register contents.
or
Use the same r command register syntax as viewing registers, but use an equal sign at the end to assign a value to the register. E.g.
MS documentation for r MS documentation for viewing & editing registers
Viewing Memory
Create and place a memory window as was shown in the UI setup video.

or
Utilize the d* set of commands, which display varying amounts of memory at a given address, with varying sizes.
db <address> L<number> == displays <number> bytes starting at <address>.
dd <address> L<number> == displays <number> doublewords (4 bytes) starting at <address>.
dq <address> L<number> == displays <number> quadwords (8 bytes) starting at <address>.
da <address> == displays as ASCII string at that address until first null terminator.
e.g.
MS documentation for full d* forms MS documentation for the display range syntax MS documentation for viewing & editing memory
Modifying Memory
Move to the desired location in a memory window, click into the window, and start typing to write values into memory at that location.
or
Utilize the e* (edit) forms, similar to the d* (display) forms, to edit values of a specific size in memory at a given address.
MS documentation for full e* forms MS documentation for the display range syntax MS documentation for viewing & editing memory
Example video:
Updating Stack View
This can be accomplished simply by putting rsp into a Memory window, and setting the size to quad hex, and adjusting the window size to only show one quadword per row, as shown in the below video.
Example video:
Stack Backtrace
From “Call Stack” Window
Open the “Call Stack” window by selecting Menu Bar -> Debug -> Call Stack or clicking the icon shown below.

Once open, you can drag it wherever you’d like on your existing WinDbg UI.
You can select additional options to be displayed once the “Call Stack” window is open. E.g. when breaking at the entrypoint of fibbonacci() in the debug build of Fibber.exe, it yields the following output by default:
and once some options are selected, it looks like this (click for full size):

MS documentation "Viewing the Call Stack in WinDbg"
From Command Window
Use k from the command window to get a stack backtrace.
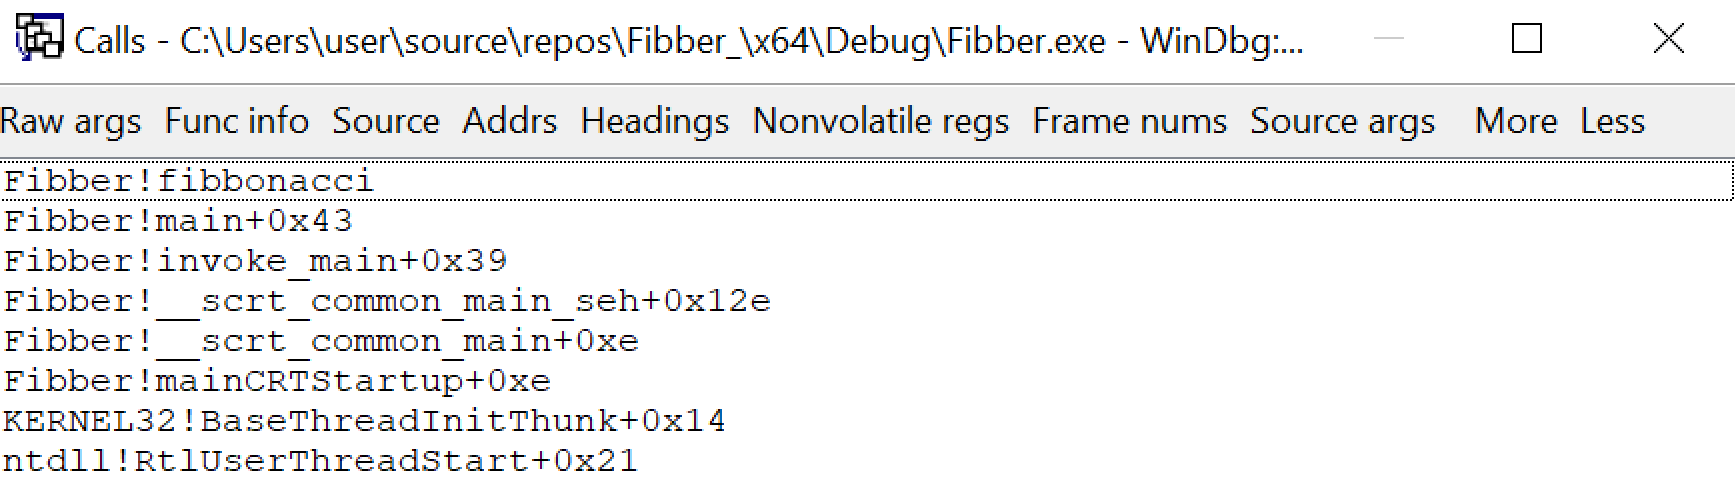
e.g. when breaking at the entrypoint of fibbonacci() in the debug build of Fibber.exe, k yields the following output.
Example video:
Step Over vs. Step Into vs. Step Out
As with other debuggers, the notion of “step over” indicates that the UI should step over call instructions - executing all instructions therein, but not showing the debugger UI as stopped until the instruction after the call instruction is reached. “Step into” on the other hand will step into call instructions. “Step out” will step until a function exit is reached.
Step Over
Use the “step over” button in the toolbar as shown below

or
Use Menu Bar -> Debug -> Step Over (shortcut F10).
or
The p command in the command window by itself will single-step over a single instruction.
The p command optionally takes a number of instructions to step forward. So p 5 will step over 5 instructions.
MS documentation for p MS documentation on "controlling the target"
Step Into
Use the “step into” button in the tool bar as shown below
or
Use Menu Bar -> Debug -> Step Into (shortcut F11 or F8).
or
The t command in the command window by itself will trace into, or single step into, a single instruction.
The t command optionally takes a number of instructions to step forward. So t 5 will step into 5 instructions.
MS documentation for t MS documentation on "controlling the target"
Step Out
Use the “step out” button in the toolbar as shown below
or
Use Menu Bar -> Debug -> Step Out (shortcut shift+F11).
or
The go up (gu) command in the Command window by itself will continue execution until it steps out of the current function context (i.e. by executing a return instruction).
MS documentation for gu MS documentation on "controlling the target"
Example video:
Run To Cursor
Click somewhere in the source or disassembly view and click the “Run To Cursor” button shown below:

Or select Menu Bar -> Debug -> Run to Cursor (shortcuts ctrl+F10 or F7).
MS documentation on "controlling the target"
Step To Address:
pa <address or symbol name> in the Command window (for step to address).
This instruction will print out every instruction it steps over on its way to that address.
MS documentation for pa MS documentation on "controlling the target"
Trace To Address:
ta <address or symbol name> in the Command window (for trace to address).
This instruction will print out every instruction it steps into (including subroutine addresses) on its way to that address.
MS documentation for ta MS documentation on "controlling the target"
The /1 Argument to Breakpoint Commands
If you pass a /1 argument to bp or ba, it “Creates a “one-shot” breakpoint. After this breakpoint is triggered, it is deleted from the breakpoint list.”
MS documentation for bp MS documentation for ba
Example video:
Attach To Process
Use Menu Bar -> File -> Attach to a Process (shortcut F6).
Then select the process to attach to, or specify a process ID (PID)
After you do this, the debugger will break within the process. You can then examine the stack backtrace, or registers and memory with the previously taught commands. Or you can set breakpoints if you know where you want to break.
You can use g to continue execution, and the “Break” icon (shortcut ctrl+break) as shown below to once again pause execution:

Example video:
Last updated